Earth's Moon (New and In Radio!)
- Alyssa Manus

- Feb 1, 2023
- 3 min read
Updated: Mar 27, 2023
Humans can't see radio waves, but the 20 meter radio telescope at the Green Bank Observatory in West Virginia can. In this project, my group and I extracted the density fluxes from Virgo A (a supermassive black hole) and the Moon from four different radio maps in order to measure the subsurface temperature of the Moon.
Hello Radio!
Optical observing can give us a lot of information (and beautiful images, of course), but radio observing give us some types of information much more easily, including reading brightness and a full spectrum of an object in the sky. Although the Green Bank Radio Telescope is 20 meters wide and 150 tons, its focus view is surprisingly small: one pixel. Because of this, it is necessary for the telescope to move and piece together a full image. This process is called raster mapping.
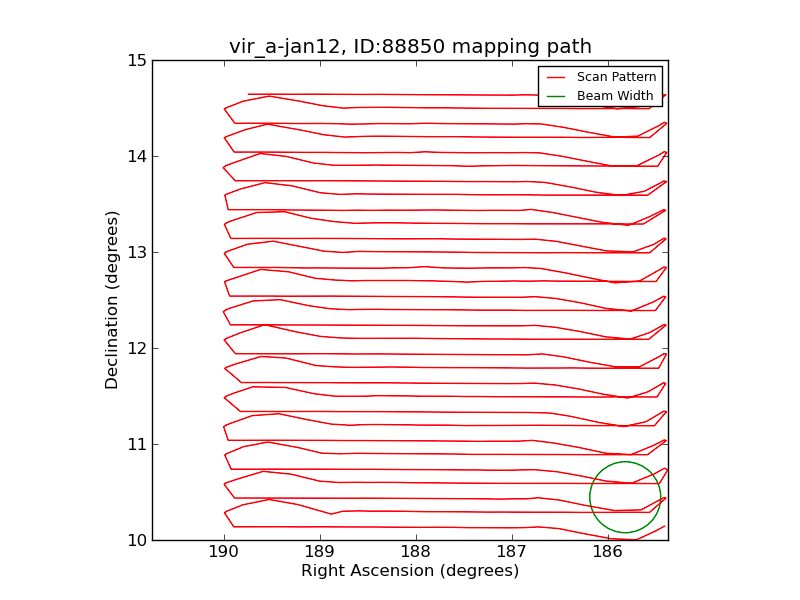
We specifically wanted to map frequencies from 1355–1435 MHz so that we could narrow out human interference. We also wanted our map to be 6 by 6 beam widths to establish the background. I used a horizontal raster pattern with gaps of 0.2 beam widths, which gives some cushion as to prevent any gaps in the map. Lastly, I set the telescopes slew speed at 0.3 seconds. The following image shows the raster path that the telescope took to create the full image:

Calibrating...
Besides the mapping path, we also get these preliminary images (show below)!
Although these look interesting, they need to be properly processed to extract data from. Luckily, Skynet's algorithm makes this fairly easy. As seen below, both channels on the telescope were working.
To start the image processing, I selected "sum" for the Channel setting since both channels were working. I also set Gain Calibration as interpolated to get the best noise-source calibration and set the image coordinates to equatorial to use right ascension and declination coordinates.
Calculating...
Our final goal is to measure the temperature of the moon as it changes phases. The first step in calculating this is to measure its brightness. We do this using the photometry tool on Skynet, which gives us the density flux in janskys.
Our group took a total of four radio images. One of Virgo A and one of the Moon on January 13, 2023, and one of Virgo A and one of the moon on January 17, 2023. This allowed us to properly calibrate the moon flux density (brightness) dividing the moon flux density (in noise-source units) by the calibration source flux desnity (in noise-source units), and then multiplying by the source flux desnity (in janskys). All four are shown below (from left to right: Virgo A 1/12/2023, Moon 1/12/2023, Virgo A 1/17/2023, Moon 1/17/2023).
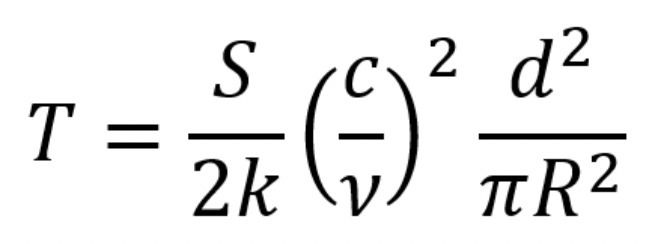
In order to find the temperature, we needed to find the moons distance at the time the images were taken. We did this using Stellarium, a downloadable software. This was all of the information we needed to make our final temperature calculations using the equation:

Final data is shown in table below:
Object | Date/Time (UTC) | Moon Phase | Density Flux (noise-source units) | Density Flux (Jy) | Distance From Earth (km) | Temperature (K) |
Vir A | 2023-01-13 09:01:29 | 1,057.047 | 229.2 | | ||
Moon | 2023:01:12 21:44:38 | 61.1% | 3,862.698 | 837.55 | 403000 | 240.52 |
Vir A | 2023-01-17 06:14:14 |
| 1,057.745 | 229.2 | n/a | |
Moon | 2023-01-17 11:54:29 | 20.6% | 4,600.333 | 997.02 | 370000 | 240.78 |
Results
From our calculation, we found that the subsurface temperature of the moon on January 12 was 240.53 Kelvin, and 240.78 Kelvin on January 17. This is a difference of 0.25 K, or about 0.45 Fahrenheit. This leads us to conclude that the Moon does not get brighter (or hotter) as phases and distance between Earth changes! Since we know the Moon does not change brightness, we can conclude that we are not looking at reflected light. The radio brightness is from thermally re-emitted light. Our group compared our results with those of professional astronomers and found that our calculations are consistent with temperatures of the Moon over the past fifty years.


Comments